More than half of the homes currently for sale in our market have had at least one price reduction. If you are thinking about selling, that number can feel alarming. But the more useful question is not how many sellers are cutting. It is whether those cuts are working, and what the data says about pricing your home the right way from the start.
How many local sellers are cutting prices right now?
Of the 6,311 homes currently on the market locally, 3,284 have had at least one price reduction. That is 52% of active listings. In the past 30 days alone, there were 2,497 price cuts.
More than 1 in 5 active listings (1,343 homes) have now been reduced two or more times.
Why are local sellers cutting prices?
The biggest driver is interest rates. When rates rise, buyers lose purchasing power quickly, even if nothing else in their financial picture changes.
I saw this happen in real time. Last week, one of my buyers was comfortably shopping homes listed around $455,000. After this week's rate increase, that same buyer may now be closer to $415,000. That is roughly $40,000 in buying power gone in a matter of days, without any change in the buyer's income, savings, or goals.
When buyers across the market lose buying power at the same time, homes priced for last month's buyer start sitting, and sellers respond with reductions.
Why aren't price cuts bringing more buyers back?
Because most cuts are too small to close the affordability gap. The typical local price cut of 2.4% on a $455,000 home is about $11,000. Compared to the $40,000 in buying power my buyer lost in one week, a reduction that size barely moves the needle. Buyers shop by monthly payment, and a small list price change rarely shifts that payment enough to matter.
How deep are price cuts in our local market?
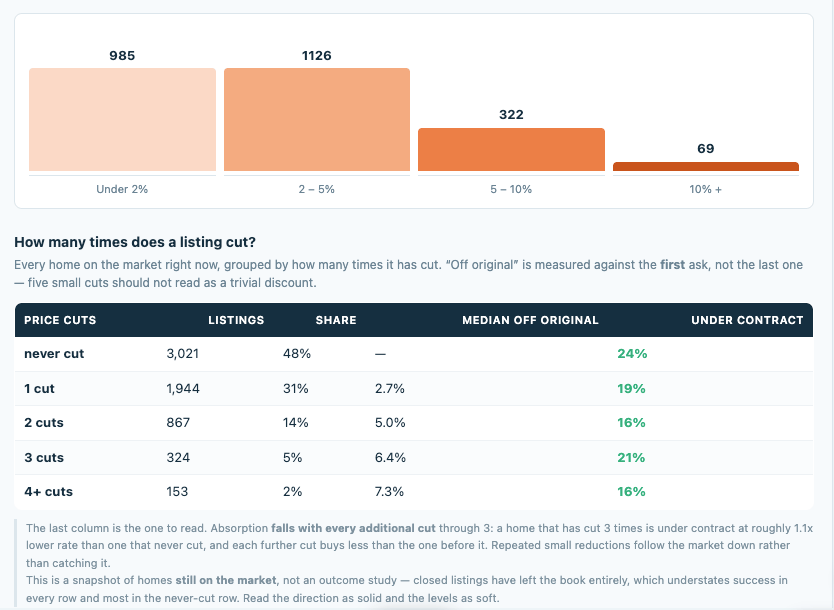
Here is how the 2,497 reductions from the past 30 days break down:
- Under 2%: 982 reductions
- 2% to 5%: 1,120 reductions
- 5% to 10%: 326 reductions
- 10% or more: 69 reductions
The median cut was 2.4%, and 84% of all reductions were under 5%. Fewer than 3% of cuts were 10% or more. Most local sellers are adjusting in small steps, and the deeper cuts tend to come from sellers who are highly motivated or who started well above the market.
Does cutting your price multiple times help your home sell?
This is where the local data gets especially useful. Here is every home currently on the market, grouped by how many times it has been reduced:
Price Cuts | Listings | Share | Median Off Original Price | Under Contract |
Never cut | 3,027 | 48% | None | 24% |
1 cut | 1,941 | 31% | 2.7% | 19% |
2 cuts | 868 | 14% | 5.0% | 16% |
3 cuts | 324 | 5% | 6.6% | 21% |
4 or more cuts | 151 | 2% | 7.3% | 16% |
Homes that have never been reduced have the highest under-contract rate at 24%. Homes with one or two cuts trail behind at 19% and 16%. Homes with four or more reductions sit a median 7.3% below their original price and still show only a 16% under-contract rate.
The takeaway is not that price cuts fail. It is that several small cuts spread out over time often trail the market rather than catch it. By the time the fourth reduction arrives, the seller has given up more total price than one well-timed adjustment might have required, and the home has accumulated days on market along the way.
One important note: this is a snapshot of homes still on the market, not a study of closed sales. Homes that sold quickly have already left the data, which likely makes the never-cut group look less successful than it really is. The direction of the data is the reliable signal. The exact percentages should be read as approximate.
Why does pricing correctly from day one matter so much?
The first two to three weeks on the market are when a listing gets its strongest attention from buyers and agents. A home priced in line with the market during that window has the best chance of generating showings and offers. A home priced above the market often spends that window being compared unfavorably to competing listings, and later reductions have to work against the perception that something is wrong.
A price adjustment is not a failure. When it is based on showing activity, buyer feedback, and competing inventory, it is a repositioning. The goal is to make one strategic move rather than several reactive ones.
Are seller concessions more effective than price cuts right now?
In many cases, they can be. Because affordability is driven by monthly payment, concessions that help a buyer buy down their interest rate can lower their payment more than an equivalent price reduction. For a buyer like mine who just lost $40,000 in buying power, a lower payment may matter far more than an $11,000 price cut.
The right mix of price and concessions depends on the home, the likely buyer, and the loan types common in that price range. Running the numbers both ways before making a change helps sellers protect their net proceeds.
How can you tell what is happening in your own zip code or neighborhood?
Market-wide numbers can hide big differences from one neighborhood to the next. I track the full breakdown of data points that impact the market, including price reductions, showing activity, under-contract rates, and inventory by zip code and neighborhood. For a seller, this data provides clarity on what the market is actually doing near their home and how likely their home is to sell at a given price.
If you are already working with an agent, they are your best resource for this conversation.
Frequently Asked Questions:
What percentage of local homes have had a price cut?
52% of homes currently on the market locally have had at least one price reduction since they were listed.
What is the typical price cut right now?
The median local price cut over the past 30 days was 2.4%, and 84% of reductions were under 5%.
How much do rising mortgage rates affect what a buyer can afford?
More than most people expect. In one recent local example, a buyer comfortable at $455,000 one week may be closer to $415,000 the next after a rate increase.
Is it bad to reduce the price of my home?
No. A reduction based on real market feedback is a normal part of selling. The local data suggests one strategic adjustment tends to work better than several small ones spread out over time.
Do homes that never cut their price sell faster?
In the current local snapshot, homes with no price reduction have the highest under-contract rate at 24%, compared to 16% to 21% for homes that have been reduced.